The report starts with the details it was built from: the profile's name, age, sex, pregnancy or breastfeeding status, physical activity level and most recent weight, plus the date range and how many days the averages are based on. If any of these look wrong, update them in the profile — the targets below depend on them.
Targets
A table of the profile's targets, with average daily intake beside each one and how far through it the intake is. Energy is always the first row — average daily intake (kJ) against the profile's daily energy target, the Estimated Energy Requirement (EER) — followed by any other target the profile has set.
Nutrient sections
Intake is compared against the Australian and New Zealand Nutrient Reference Values (NRVs), one section per reference type:
- Recommended Dietary Intake (RDI) — the intake that meets the needs of nearly all healthy people.
- Estimated Average Requirement (EAR) — the intake that meets the needs of half of healthy people.
- Adequate Intake (AI) — used where no RDI has been set.
- Upper Level of Intake (UL) — the highest intake likely to pose no adverse health effects.
- Suggested Dietary Target (SDT) — targets for chronic disease prevention, shown as minimums, maximums, or a range where the NRVs publish one.
- Acceptable Macronutrient Distribution Range (AMDR) — the recommended share of daily energy from each macronutrient, shown as "% energy" rather than grams.
Each section shows a bar per nutrient with a table of exact values underneath.
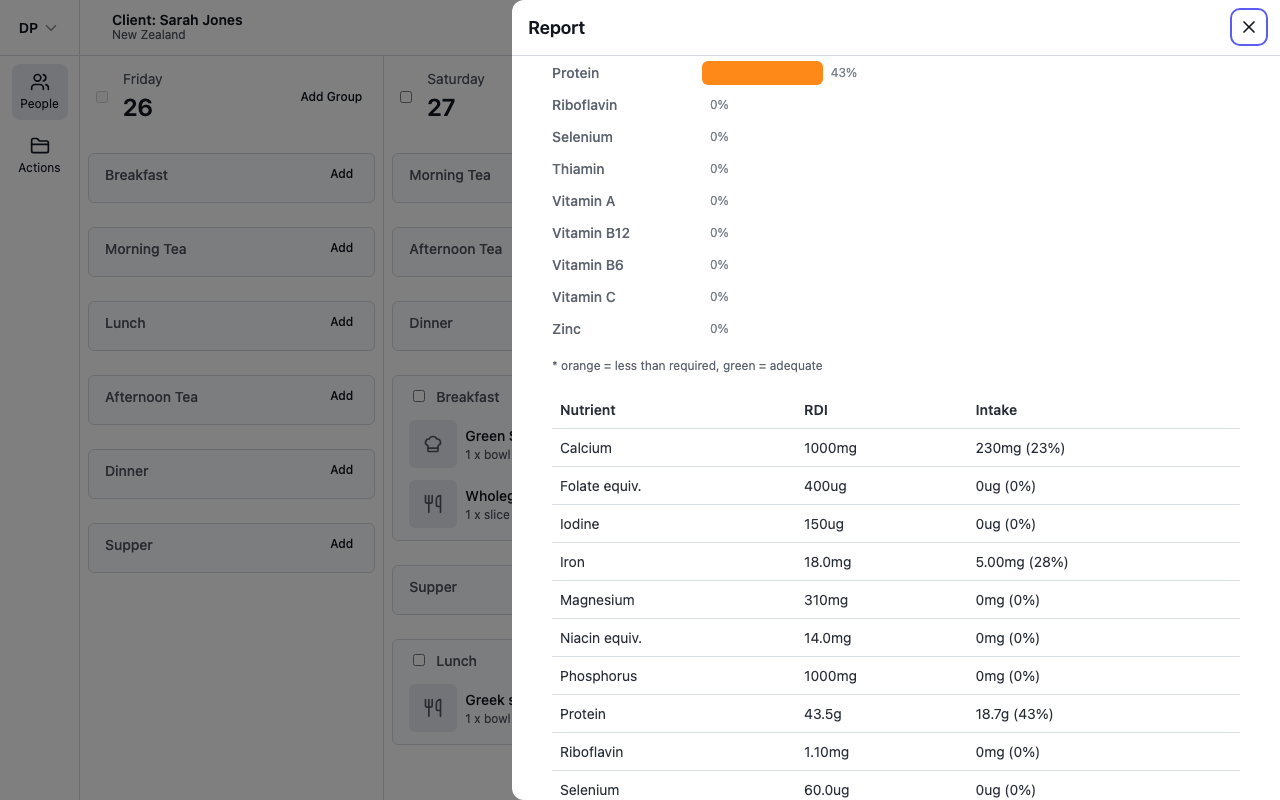
Reading the colours
- Green — adequate: the target is met, or intake is within the limit.
- Orange — below the required intake.
- Red — over an upper limit or maximum (UL, SDT maximum or AMDR maximum sections only).
Bars are capped at 200%, so a very high intake still shows its true percentage as a number.
Why orange here but not in the diary? The diary shows days still in play, so its bars stay purple while you are working toward a target — being under partway through a day isn't a finding. A report averages a finished period: being under the requirement across that whole period is worth flagging, and orange is that flag. Green and red mean the same thing in both places.
Notes on specific targets
- Protein RDI and EAR targets are set per kilogram of body weight, so they use the profile's most recent weight.
- Pregnancy and breastfeeding targets are applied based on the profile's status on the report's end date.
- Some nutrients in the NRVs are not present in every food database. When that happens the section lists them in a footnote — for example "RDI nutrients not available in FoodFiles 2024" — instead of reporting a misleading zero.
Macronutrient and Fat Ratio
Two pie charts close the report. Macronutrient Ratio shows the share of energy coming from protein, carbohydrate, fat, alcohol and fibre. Fat Ratio breaks total fat into saturated, monounsaturated and polyunsaturated fat.